In the world of technical trading, few tools are as widely respected and frequently used as Fibonacci retracements. Rooted in mathematical ratios observed in nature, Fibonacci levels have become a cornerstone for traders seeking to pinpoint high-probability entry and exit points. These levels help identify potential support and resistance areas based on prior price movements, providing a framework for strategic decision-making. When applied with discipline and context, Fibonacci retracements can enhance both trend continuation and reversal strategies.
What Are Fibonacci Retracements and Why They Work
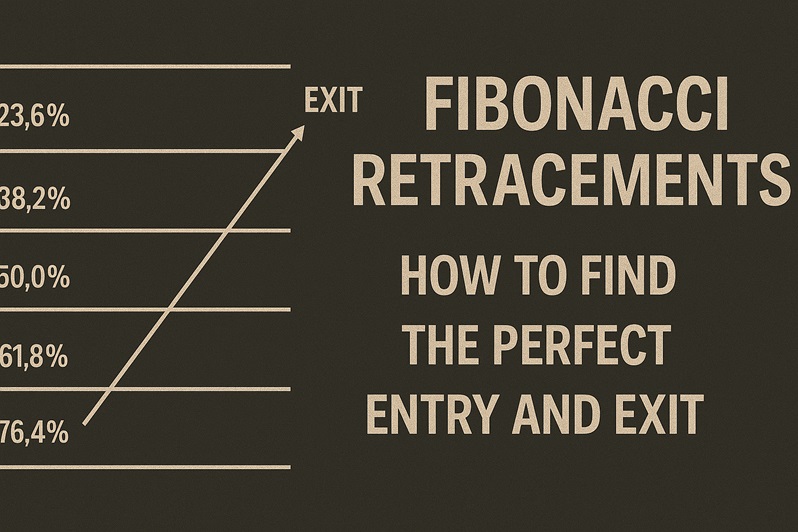
Fibonacci retracements are horizontal lines drawn across a price chart to indicate areas where a pullback is likely to stall before the trend resumes. Common retracement levels include 23.6%, 38.2%, 50%, 61.8%, and 78.6%, all derived from the Fibonacci sequence. These levels are not just arbitrary—they reflect natural patterns in price behavior driven by trader psychology.
Markets don’t move in straight lines. Trends often retrace a portion of their movement before continuing in the original direction. Fibonacci levels help traders visualize these pullbacks and prepare for entry opportunities during corrections. Likewise, they can act as potential exit points during retracements against open positions, especially when price action and volume support a potential shift.
Integrating Fibonacci with Market Structure and Confirmation Tools
While Fibonacci retracements offer a visual guide, they are most powerful when used in combination with other technical tools. Price action, support and resistance zones, and trendlines can all validate a Fibonacci level as significant. For instance, if a 61.8% retracement aligns with a previous breakout area or a key trendline, the confluence increases the level’s reliability.
Candlestick patterns and momentum indicators like RSI or MACD can further confirm entries or exits. A bullish engulfing candle forming at a 50% retracement during an uptrend can serve as a strong signal to re-enter the trend. Likewise, bearish divergence at a 38.2% level could indicate a failed recovery and a good point to exit or even reverse a position.
Timeframe alignment is another way to boost the effectiveness of Fibonacci analysis. Levels drawn on higher timeframes often act as stronger zones of interest than those on shorter ones. When levels from different timeframes overlap, they often represent highly reactive price areas.
Strategic Application for Entry and Exit
For entries, traders look to initiate positions when price pulls back to a Fibonacci level and shows signs of continuation—either through breakouts, volume spikes, or confirmation patterns. Placing stop-loss orders just beyond the next retracement level provides structure and minimizes risk.
For exits, Fibonacci retracements can define partial profit zones or complete trade closures. In a long position, if price extends to a previous swing high but starts reacting at the 38.2% level, it might indicate slowing momentum. Some traders also use Fibonacci extensions in conjunction with retracements to target future price projections.
Ultimately, mastering Fibonacci retracements requires more than memorizing levels—it’s about developing the skill to recognize context and confirmation. Used correctly, this tool offers a disciplined framework for maximizing profit and reducing risk.
Conclusion
Fibonacci retracements provide traders with a powerful lens to anticipate market behavior and structure their trades with precision. Whether entering during pullbacks or managing exits at reaction zones, Fibonacci levels deliver clarity in chaotic price action. The key lies in combining these levels with other technical insights and maintaining a consistent, disciplined approach. By doing so, traders can transform a simple concept into a reliable strategy that elevates their trading performance.
FAQs
What is the most reliable Fibonacci retracement level?
The 61.8% level is often considered the “golden ratio” and tends to be a strong support or resistance zone.
Can Fibonacci retracements be used in all markets?
Yes, they’re widely used in Forex, crypto, stocks, and commodities, especially in trending markets.
Are Fibonacci retracements predictive or reactive?
They are reactive tools based on previous price moves, but traders use them to anticipate future reactions.
How do I know which swing high and low to use?
Use significant peaks and troughs that define a clear move, typically confirmed by volume or price structure.
Can Fibonacci levels be automated in trading platforms?
Yes, most platforms like MT4, TradingView, and MetaTrader 5 allow automated Fibonacci drawing tools.